

Encryption has turned mobile network data analytics into a visibility problem, not just a tooling gap.
Key Takeaways
Legacy network analytics, reliant on payload inspection, fail as traffic shifts to TLS 1.3 and QUIC, creating significant operational and commercial blind spots.
Visibility can be restored without decryption by using behavioral classification, which analyzes flow metadata like packet sizes, timing, and connection patterns to identify applications.
Raw telemetry only becomes actionable intelligence after it passes through an enrichment pipeline that performs GTP correlation to add subscriber context and normalizes data into consistent xDR formats.
For operators in emerging markets, data sovereignty is a primary architectural constraint, often requiring on-premises analytics platforms that keep all subscriber data within national borders.
Effective analytics architectures converge classification, enrichment, and policy management in a single layer to close the gaps between network visibility, quality of experience, and charging accuracy.
For an operator, the realization comes not from a technical alert but from a commercial failure. Its legacy analytics stack, built for a world of readable packet payloads, begins classifying over 85% of subscriber traffic as "application-unknown." Almost overnight, congestion reports lose their granularity and Quality of Experience (QoE) dashboards become unreliable. This scenario is becoming the norm. The discipline of mobile network data analytics was designed for a level of visibility that widespread encryption has now taken away.
The core tension is simple: operators are accountable for network performance, service quality, and billing accuracy, but they can no longer see what is running on their own infrastructure. This isn't a simple tooling gap; it reflects a structural change in what the network exposes to its operator.
This guide explains how operators can navigate this new reality. We will cover what modern mobile network analytics actually involves, why encryption structurally invalidates legacy approaches, and how behavioral classification restores visibility without decryption. We will then walk through the data pipeline required to turn raw telemetry into actionable intelligence, how that intelligence connects to operational decisions, and why data sovereignty is a non-negotiable architectural constraint for many operators.
What Mobile Network Data Analytics Actually Involves
Mobile network data analytics is the discipline of collecting, correlating, and interpreting telemetry from the control, user, and management planes of a mobile network to support operational, commercial, and regulatory decisions. It is fundamentally different from generic enterprise or web analytics. The data sources are specific to mobile networks GTP tunnels, Diameter signaling, PFCP sessions, RAN counters the scale involves millions of concurrent subscribers, and the constraints include real-time policy requirements and strict data sovereignty rules.
For a mobile operator in an emerging market, the cost of fragmented analytics is not abstract. It shows up as duplicated tooling budgets, delayed incident resolution because the network-operations and data-services teams query different data stores, and an inability to justify infrastructure investments with consistent evidence. At NovaTel, correlating RAN counters from cell sites with GTP-U flows from the packet core and Gx/Gy diameter messages from the PCRF is essential to diagnose a single subscriber complaint.
A unified analytics approach is no longer an efficiency play; it is a prerequisite for coherent network management. Understanding the data sources and collection methods is the first step.
Core Data Sources in a Mobile Packet Core
An operator-grade analytics platform must ingest and correlate telemetry from several distinct domains. Each source provides a different piece of the puzzle:
Control-Plane Signaling: Data from protocols like S1-AP, N2/N4 (PFCP), and Gx/Gy (Diameter) reveals the session lifecycle. It tells the platform when a subscriber connects, what policies are applied, and what quality of service is requested.
User-Plane Traffic: This is the actual data flowing through GTP-U tunnels on S1-U or N3 interfaces. Analyzing this traffic reveals application behavior, volume, and performance.
RAN Performance Counters: Telemetry from the Radio Access Network, such as per-cell throughput, Physical Resource Block (PRB) utilization, and handover success rates, describes the radio conditions each subscriber experiences.
Management-Plane Data: Logs from network elements (syslog), alerts (SNMP traps), and configuration baselines provide operational context and fault information.
Effective mobile network analytics is not about analyzing a single feed. It is a correlation problem that requires stitching together these disparate sources to build a complete picture of network and subscriber activity.
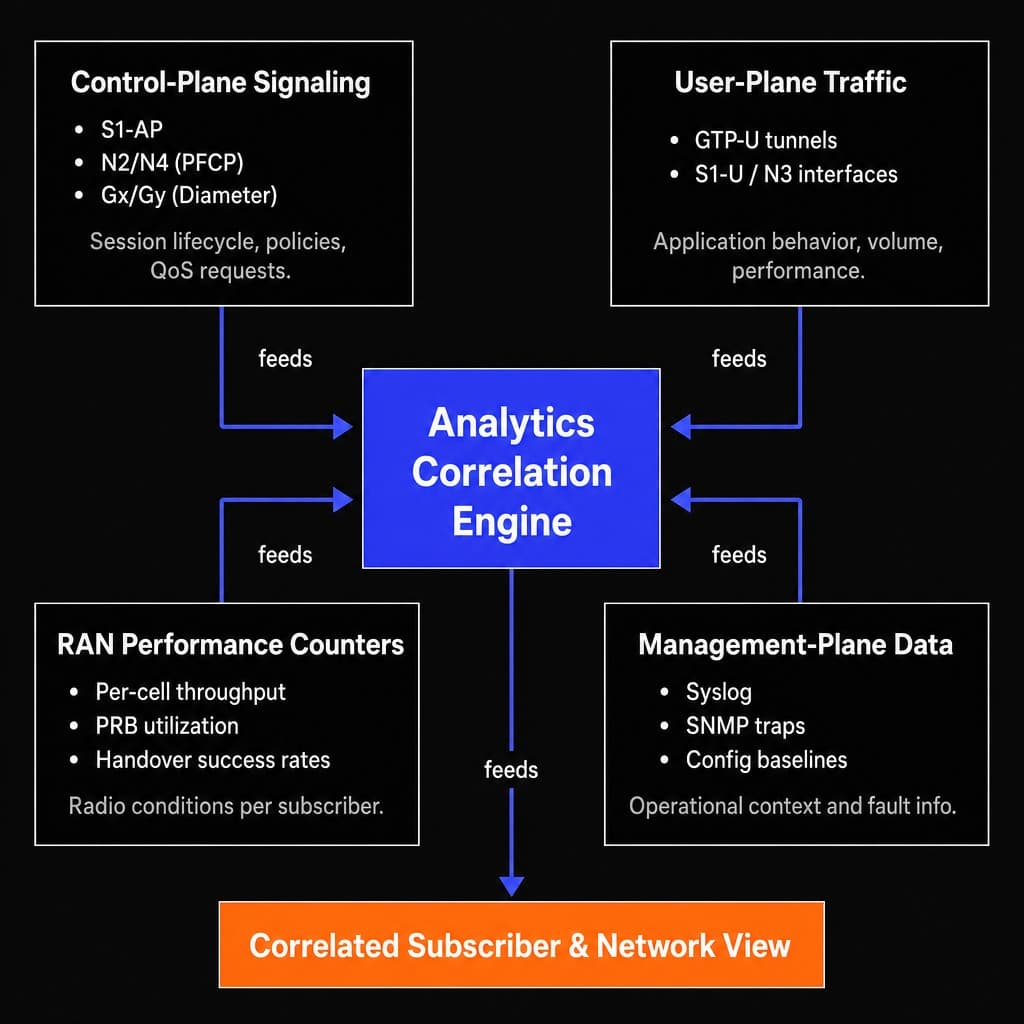
Mobile network analytics requires correlating four distinct telemetry domains into one view.
Probe-Based vs. Flow-Based Collection
Operators typically use one of two architectures to collect user-plane data. The choice between them fundamentally shapes what questions the analytics platform can answer.
Probe-Based Collection: This approach deploys dedicated hardware or virtual probes at key tap points, such as the S1-U, N3, or SGi/Gi interfaces. Because probes see every packet, they can perform deep analysis, session reconstruction, and real-time application classification.
Flow-Based Collection: This method relies on summary records (like IPFIX or NetFlow) exported by network elements such as routers and User Plane Functions (UPFs). It is often less expensive to deploy but provides a coarser view, as it reports on metadata summaries rather than full packet streams.
The trade-off is clear: probes offer high-fidelity visibility needed for application-level policy, while flow records provide a more aggregated view suitable for high-level traffic accounting. Deployment mode matters as well: inline placement enables policy action on classified flows in real time, while passive tapping supports analytics but cannot enforce policy. As encryption obscures application details, the limitations of basic flow records become more pronounced.
Read more: The Vital Role of Accurate Traffic Classification in Today's Digital World 31C
Why Encryption Breaks Legacy Analytics Architectures
The core problem for legacy analytics is not just encryption, but the specific mechanisms of modern protocols like TLS 1.3 and QUIC. Previously, even with encrypted payloads, operators could rely on plaintext metadata in the connection setup. That is no longer the case. TLS 1.3 encrypts the server certificate, and the widespread adoption of Encrypted Client Hello (ECH) is systematically removing the Server Name Indication (SNI) field the last reliable plaintext identifier for passive observers. QUIC further complicates this by multiplexing multiple application streams within a single encrypted tunnel, making them indistinguishable from the outside.
For a legacy Deep Packet Inspection (DPI) probe, this removes the plaintext identifiers its classification logic depends on. It can still see IP addresses and port numbers, but it can no longer read HTTP headers or reliably extract hostnames. This shift doesn't just degrade accuracy; it breaks the logic of downstream systems.
Consider a mobile operator in a market where QUIC adoption crosses 40% of total traffic in a single quarter. Its legacy DPI appliance, tuned for TLS 1.2 with readable SNI, suddenly reports a growing share of sessions as 'unknown application.' The network-operations team notices the degradation not through an analytics dashboard but because its zero-rating policy for a popular streaming service stops working as agreed. Subscribers are billed for traffic that should be free, because the classifier can no longer identify the service inside QUIC's encrypted envelope, and the resulting complaints and disputes put the content partnership at risk. That sequence, where a protocol shift breaks a commercial agreement before it registers as a technical problem, illustrates exactly why treating analytics as a passive reporting function is no longer viable. The pressure is not limited to QUIC. ECH doesn't just hide the SNI; it also breaks passive TLS fingerprinting methods like JA3 that rely on the ClientHello's plaintext structure, meaning operators who migrated from SNI-based classification to TLS fingerprinting face a second displacement in rapid succession.
Read more: Encrypted Traffic Dominates the Internet: How Data Intelligence Helps 31C
Behavioral Classification: Restoring Visibility Without Decryption
If payload content and plaintext metadata are unavailable, classification must rely on the observable characteristics of the traffic flow itself. This is the principle behind behavioral classification, a machine learning-based approach that restores visibility into encrypted traffic without requiring decryption.
The technique analyzes a collection of features from a traffic flow, including:
Packet sizes and their distribution.
Inter-arrival times between packets.
The sequence and timing of a connection setup.
TLS handshake parameters (where visible, as with JA3 fingerprinting).
Machine learning models trained on representative, labeled traffic samples can map these behavioral signatures to known applications. For example, an encrypted video stream produces a characteristic pattern of large, steady downstream packets after an initial burst of smaller negotiation packets. This signature is measurably different from an encrypted messaging session, which typically involves smaller, more symmetric packets with irregular timing.
It is important, however, to be clear about the nature of this approach. Classification accuracy depends heavily on the quality of model training, the diversity of traffic seen, and the specific network location where traffic is observed. No method identifies every application correctly. The value lies in restoring a high-fidelity view that is sufficient to drive policy, charging, and QoE decisions in a network that would otherwise be a black box. Read more on why legacy DPI approaches fall short against today's encrypted, complex applications.
Building the Analytics Pipeline: From Tap Point to Enriched xDR
Raw telemetry, even when classified, is not yet intelligence. It becomes intelligence when it is correlated across different network planes, enriched with subscriber and session context, and normalized into structured records that analytics and policy systems can consume. This data engineering layer is what separates a simple monitoring tool from an operator-grade analytics platform. The process involves two critical steps: GTP correlation and xDR enrichment.
The quality of an operator's analytics output is determined by the quality of this enrichment pipeline, not just the quality of its classification engine. For an operator like NovaTel, traffic classified at the UPF tap point must first be correlated with GTP tunnel identifiers to associate it with a subscriber, then enriched with session metadata from the PCRF before it can be written as an xDR that billing and QoE systems can actually use.
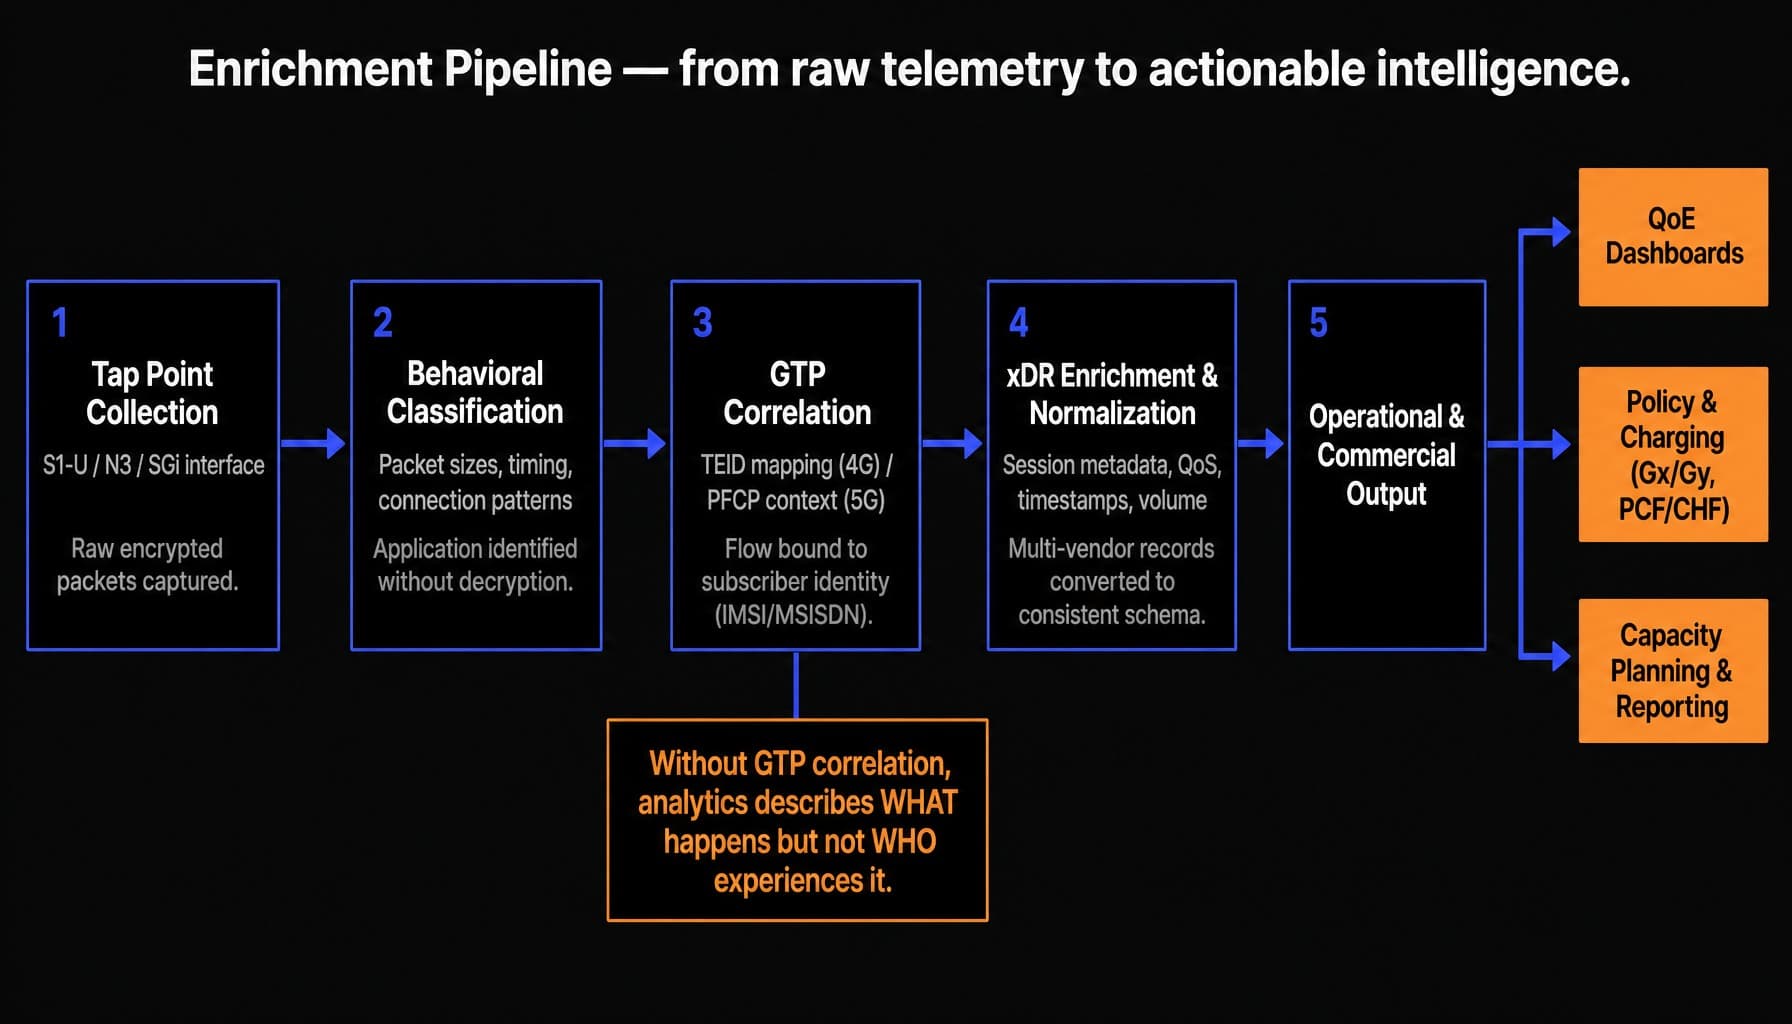
Raw telemetry becomes mobile network analytics intelligence through this five-stage pipeline.
GTP Correlation and Subscriber Context
In 4G/LTE networks, all user-plane traffic is encapsulated in GPRS Tunnelling Protocol (GTP-U) tunnels. Each tunnel has a Tunnel Endpoint Identifier (TEID) that maps to a specific data bearer for a specific subscriber. In 5G, the equivalent process uses PFCP session context on the N4 interface between the Session Management Function (SMF) and the User Plane Function (UPF).
GTP correlation is the process of binding a user-plane IP flow to its corresponding GTP tunnel context, and through that, to the subscriber's identity (IMSI or MSISDN). This is the crucial step that turns a raw IP flow into a subscriber-aware record. Without it, analytics can describe what is happening on the network but cannot attribute it to who is experiencing it. Subscriber-level QoE monitoring, per-user policy management, and application-aware billing are all impossible without this correlation.
xDR Enrichment and Mediation Feed Normalization
Once a flow is classified and correlated to a subscriber, the analytics platform generates an extended data record (xDR). An xDR is a structured log that combines application identity, subscriber identity, session metadata, applied QoS parameters, timestamps, and volume counters into a single, comprehensive record.
These xDRs must then be normalized. In a typical multi-vendor network, elements from different suppliers produce records in different formats. Mediation feed normalization ensures that xDRs from a Huawei PGW, an Ericsson UPF, and a Nokia SMF are all converted into a consistent schema that downstream systems can consume. Normalization also depends on timestamp alignment across control-plane and user-plane sources; even small clock drifts between the SMF and UPF can cause session-correlation failures that silently degrade analytics accuracy. For operators running mixed-vendor cores, this normalization step is where raw telemetry becomes commercially and operationally actionable.
Connecting Analytics to Operational and Commercial Decisions
Analytics is not an end in itself. Its value is measured by the operational and commercial decisions it enables. For mobile operators, these decisions fall into two broad categories: managing service quality and supporting monetization. Telemetry that does not lead to a clear decision adds storage and processing cost without adding operational value.
Subscriber-Level Quality of Experience
Effective QoE management requires correlating application performance such as video resolution, buffering events, or voice call quality with per-subscriber session context. This includes the subscriber's location, device type, service plan, and real-time radio conditions.
Consider NovaTel's data-services team investigating high churn in a specific region. Aggregate network statistics are unhelpful. However, subscriber-level analytics reveal that video QoE for customers connected to three particular cell sites degrades sharply during evening hours. Further correlation with RAN and transport data shows that the root cause is insufficient backhaul capacity at those sites, not RAN congestion. This insight changes the investment decision entirely, from adding expensive radio capacity to upgrading the backhaul links a more targeted and cost-effective solution. QoE analytics must be both subscriber-aware and application-aware to produce this level of actionable insight.
Policy and Charging Integration
Analytics and policy management are most effective when they operate from a shared data layer. When an analytics platform classifies a flow as belonging to a zero-rated gaming service, the policy engine must be able to apply the correct charging rule in real time. This can only happen if both systems see the same classification result at the same time.
Key integration points include the Gx interface for dynamic policy decisions and the Gy interface for online charging in 4G, with equivalent functions handled via the Policy Control Function (PCF) and Charging Function (CHF) in 5G. Fragmented architectures, where analytics and policy run on separate platforms from different vendors, tend to create reconciliation gaps. When classification and charging decisions diverge, these gaps can contribute to revenue leakage, billing discrepancies, and inconsistent subscriber experience.
Data Sovereignty and On-Premises Analytics for Emerging-Market Operators
For many operators, especially in emerging markets, analytics architecture is dictated by a non-negotiable constraint: data sovereignty. National data protection laws, telecom licensing conditions, and government oversight mandates often prohibit sending subscriber-level network telemetry to cloud analytics platforms hosted outside the country.
Where these rules apply, the analytics architecture must support on-premises deployment as its primary operating mode rather than as an optional feature. Collection, enrichment, and storage of subscriber-level records then need to run on infrastructure that remains within national borders.
The sovereignty issue extends beyond data location. If generating insights requires specialist query skills, and the only analysts with those skills work for an offshore vendor, the operator has a de facto data-export problem even if the platform itself runs locally. This creates a dependency that can conflict with the spirit, if not the letter, of sovereignty rules. Analytics interfaces that support local languages and allow non-specialist teams to ask questions in plain language can mitigate this dependency, ensuring that network intelligence remains under the operator's direct control.
How ODUN.ONE Converges Visibility, Policy, and Analytics in a Sovereign Architecture
The challenges outlined eroding visibility from encryption, the need for an enriched data pipeline, and strict sovereignty requirements often force operators into a complex, multi-vendor integration project. An operator might use one vendor for classification, another for analytics, and a third for policy, each with its own data model and operational interface.
31C's ODUN.ONE platform takes a converged approach to this problem. It combines encrypted-traffic classification, analytics, policy management, and operations in a single, modular platform architected for on-premises deployment.
DataONE provides the core traffic visibility, identifying 3,500+ applications with up to 98% accuracy using behavioral classification without decryption, with actual accuracy depending on deployment conditions.
AnalyticsONE turns the resulting metadata into long-term dashboards and reports for QoE and capacity planning.
OpsONE provides centralized management and observability, critical for distributed deployments.
Because these components share one stack, the same classification intelligence that feeds an analytics dashboard can also drive real-time policy and charging decisions. Furthermore, the Data-Talk natural-language interface, supporting 9+ languages, allows local operations and commercial teams to query network data directly, reducing reliance on offshore specialists for day-to-day analysis.
The most important shift for operators is to recognize that mobile network data analytics is no longer a visibility problem that better dashboards can solve. It is an architectural problem that requires classification, enrichment, policy convergence, and sovereignty to be addressed together.
Encryption has structurally changed what operators can observe. Behavioral classification restores application awareness without decryption, but that awareness only becomes intelligence when it flows through an enriched pipeline into operational and commercial decisions. The entire chain must run where the operator's data-sovereignty rules allow.
Operators who continue to treat analytics as a standalone reporting tool will accumulate telemetry they cannot act on. Treating it as an integrated layer of the network architecture gives classification results from encrypted traffic a direct path into policy, charging, and planning decisions. That shift depends on applying data intelligence across network operations rather than to isolated feeds.
Frequently Asked Questions
What is the difference between NWDAF and a commercial mobile network analytics platform?
3GPP's NWDAF (Network Data Analytics Function) defines a standard for exposing network data within the 5G core. It provides a framework but doesn't prescribe the analytics engine or enrichment depth. Commercial platforms typically supply those components, such as application classification, historical analytics, and policy integration tools, and can operate alongside the NWDAF standard rather than replace it.
How do multi-generation networks (4G and 5G) affect analytics architecture?
Most operators run 4G and 5G simultaneously, so an analytics platform must correlate telemetry from both GTP-based (4G) and PFCP-based (5G) architectures. It must normalize different signaling protocols and session models into a common data format. A platform supporting only one generation forces the operator to maintain parallel toolsets, fragmenting subscriber visibility and increasing complexity.
Can mobile network analytics help operators monetize subscriber data responsibly?
Yes, primarily through application-aware billing, zero-rating verification, and tiered QoS offerings not by selling raw subscriber data. Responsible monetization depends on applying policy at the application level and aggregating or anonymizing data for commercial insights. The analytics architecture's privacy and sovereignty controls are essential for ensuring any monetization strategy remains compliant and ethical.
What should system integrators evaluate when deploying network analytics for an operator?
Integrators should assess the deployment mode (inline vs. passive), multi-vendor normalization capabilities, and integration points with existing BSS/OSS. They must also consider on-premises infrastructure constraints, local skill requirements for operation, and the vendor's professional-services dependency, as this significantly impacts the total cost of ownership for the operator.
How does control-user plane separation (CUPS) change analytics tap-point strategy?
CUPS allows the user plane (UPF) to be deployed at the network edge, meaning the analytics tap point must also move to these distributed sites. Operators must plan for distributed probe deployment or select an analytics platform that supports centralized management of multiple remote tap points without requiring specialist staff at each location.
Is real-time analytics always necessary, or can batch processing suffice?
It depends on the use case. Real-time analytics is essential for dynamic policy control, live congestion management, and security anomaly detection. Batch or near-real-time processing is sufficient for capacity planning, historical trend analysis, and regulatory reporting. Most operators need both: a real-time layer for policy and a historical layer for analysis.